Search and AI visibility
4 client sites, each named, each with a PDF built on its own Google Search Console account: search and AI data to 16 October 2026, page indexing as of 12 October 2026.
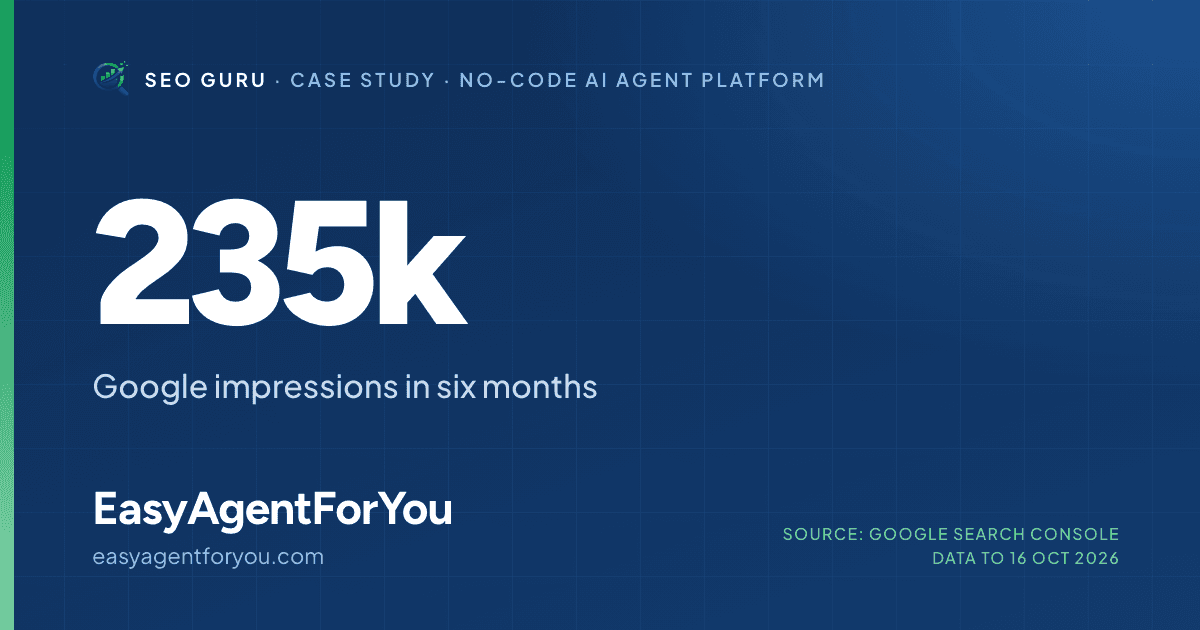
How a programmatic use-cases library took a no-code AI agent platform from near-zero visibility to 235k impressions and 42.8k AI-answer appearances.
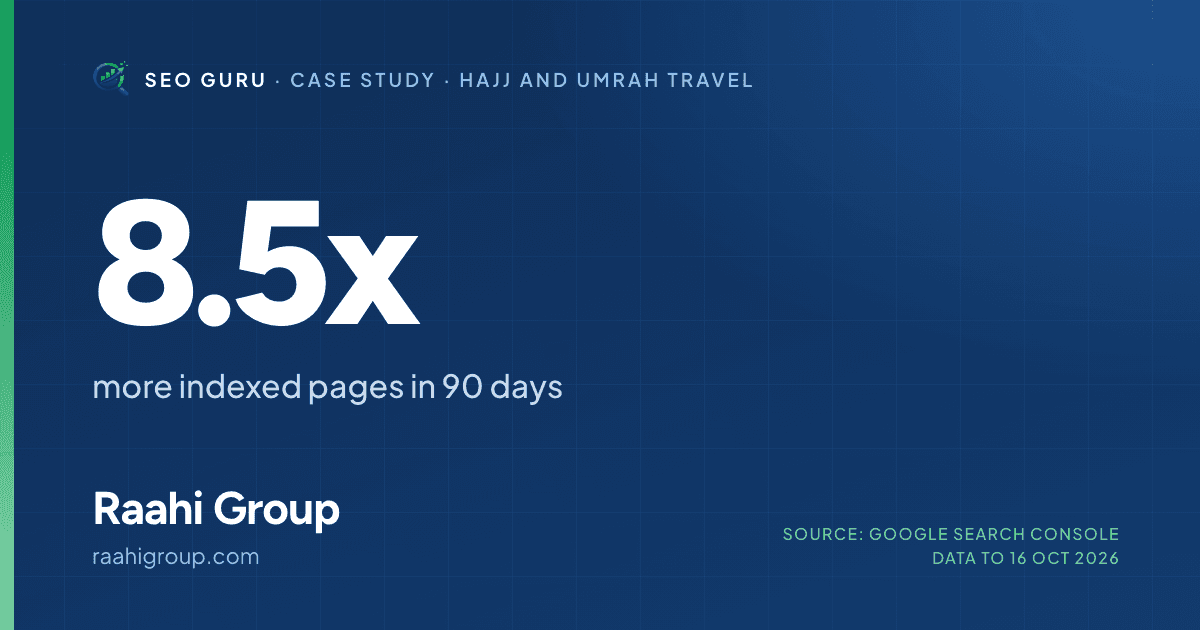
How an indexing clean-up and a library of pilgrim-question pages took a Hajj and Umrah operator from 45 indexed pages to 384, with 706 clicks in 90 days.
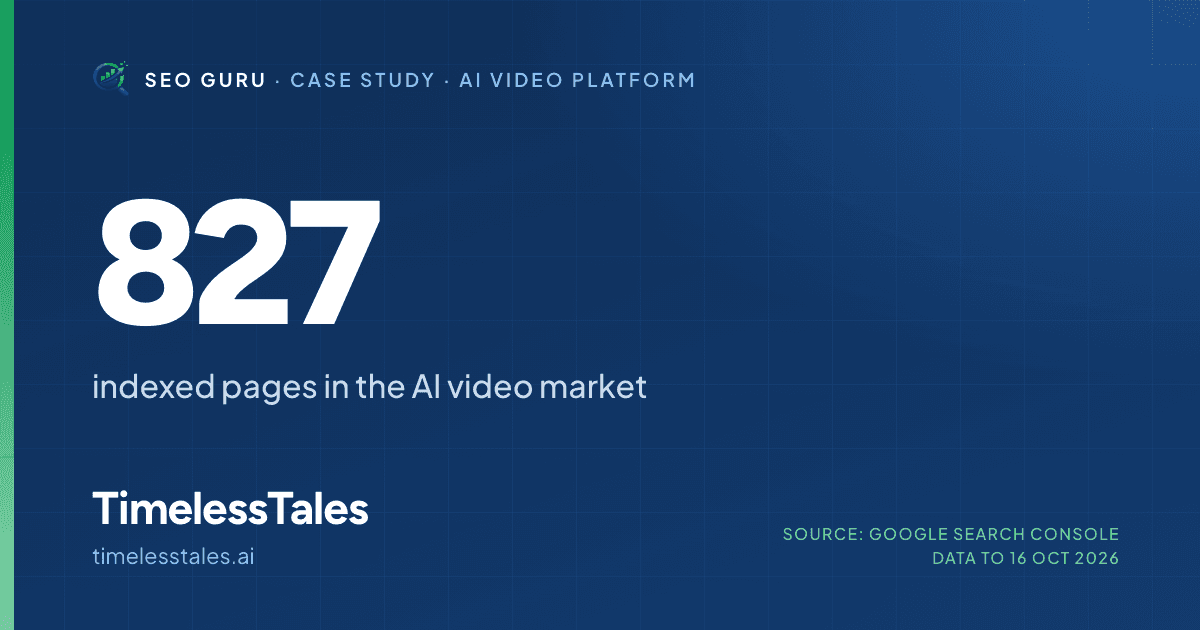
How two programmatic templates put a new AI video platform into the research phase against Runway and Synthesia: 827 indexed pages, AI citations up 52%.
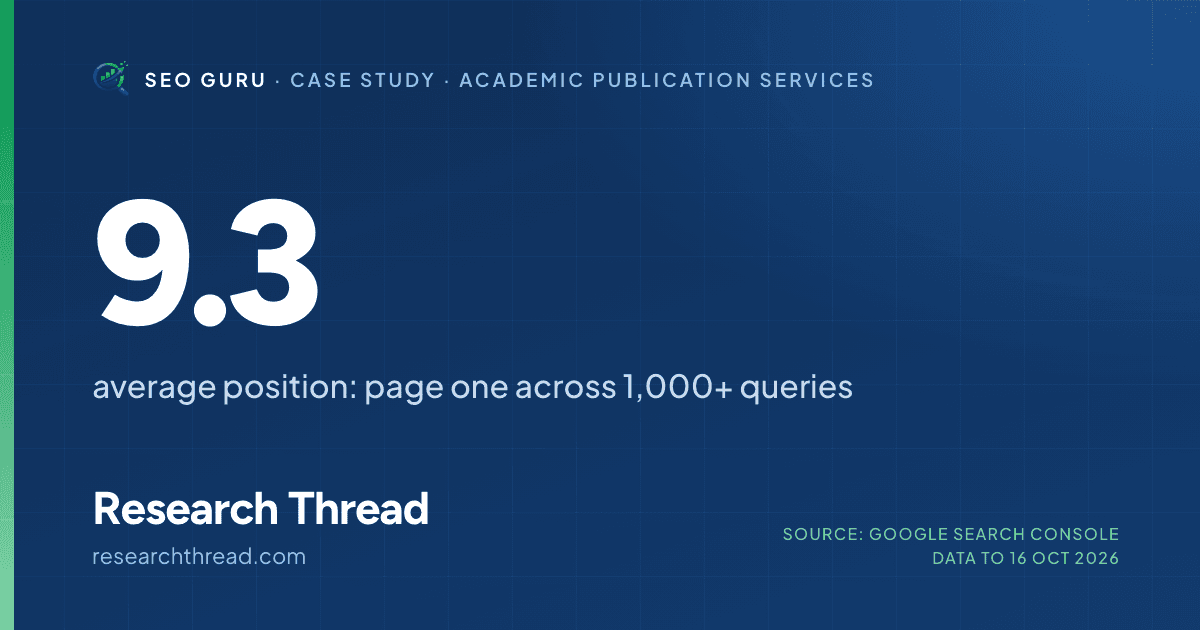
How an authority hub on Q1 journals, HJRS categories and submission rules holds a publication service at an average position of 9.3 with 7k AI citations.
The Search Console pack
| Site | Impressions | Clicks | Avg. position | Indexed | AI-answer impr. | Pages in AI answers |
|---|---|---|---|---|---|---|
| easyagentforyou.com | 235k (6 mo) | 1.25k | 14.4 | 230 | 42.8k | 235 |
| raahigroup.com | 35.4k | 706 | 24.2 | 384 | 2.29k | 153 |
| timelesstales.ai | 45.7k | 391 | 19.4 | 827 | 1.86k | 214 |
| researchthread.com | 80.1k | 520 | 9.3 | 556 | 7.07k | 281 |
Same four properties, same reporting method, one rolling quarter later: the previous pack ran to 29 September 2026, this one to 16 October 2026.
| Combined metric | Previous report | This report | Change |
|---|---|---|---|
| Google impressions | 323k | 396k | +23% |
| Organic clicks | 2.20k | 2.87k | +30% |
| AI-answer impressions | 41.3k | 54.0k | +31% |
| Pages cited in AI answers | 732 | 883 | +21% |
| Indexed pages | 1.92k | 2.00k | +4% |
Download the Search Console pack (ZIP)Pack summary (PDF)Five PDFs, with the Search Console screenshots behind every figure.
The search playbook
- Fix indexation first so every page can compete. Across the four properties the indexed set is now counted, not assumed.
- Answer-shaped content at scale: programmatic libraries of comparisons, "best X for Y" lists and rules-and-requirements pages.
- Entity and niche focus: own a clear topic — multi-AI platforms, Q1 and HJRS journals, Hajj and Umrah rules — rather than chasing broad head terms.
- Structured data (breadcrumbs, review snippets, video) for clean, machine-readable context.
- Measure AEO directly with Search Console's Generative AI features report, not only with rankings. AI-answer impressions are growing faster than classic impressions on every property in this pack.
Growth programmes
11engagements across paid media, lifecycle, conversion and organic growth, published without the client's name. The figures are the ones each engagement brief reports, and each study says which of them the brief evidences with a platform screenshot, for which period, and which it only states.
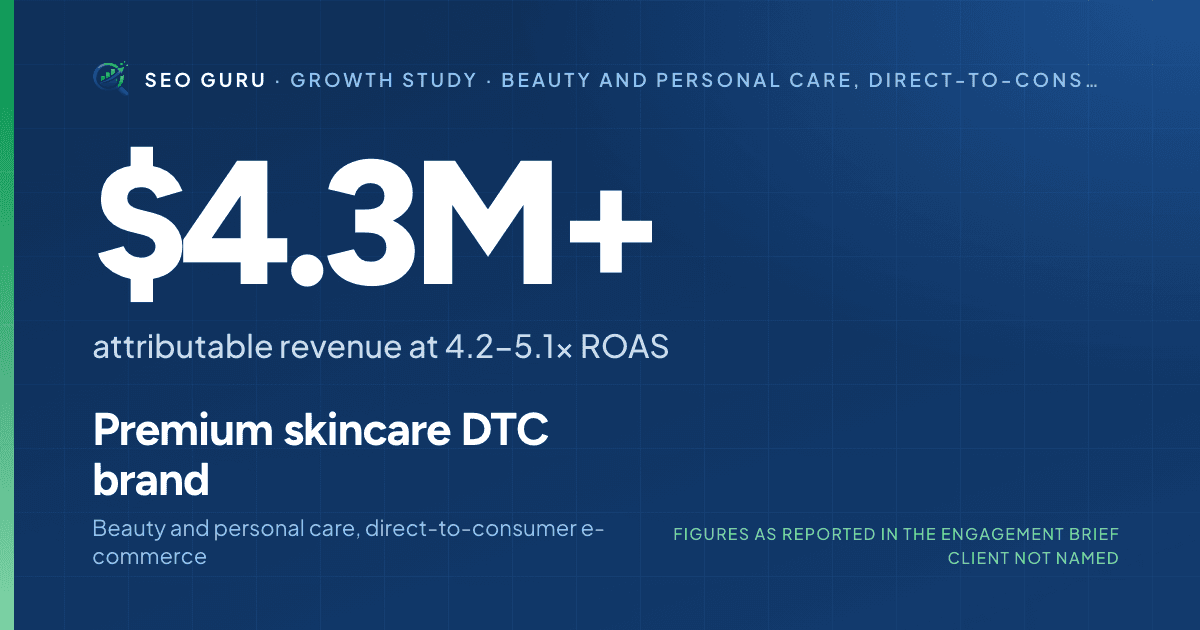
How rebuilt Meta and Google campaigns, UGC-versus-founder creative tests and bundle offers took a premium skincare brand to $4.3M+ in attributable revenue.
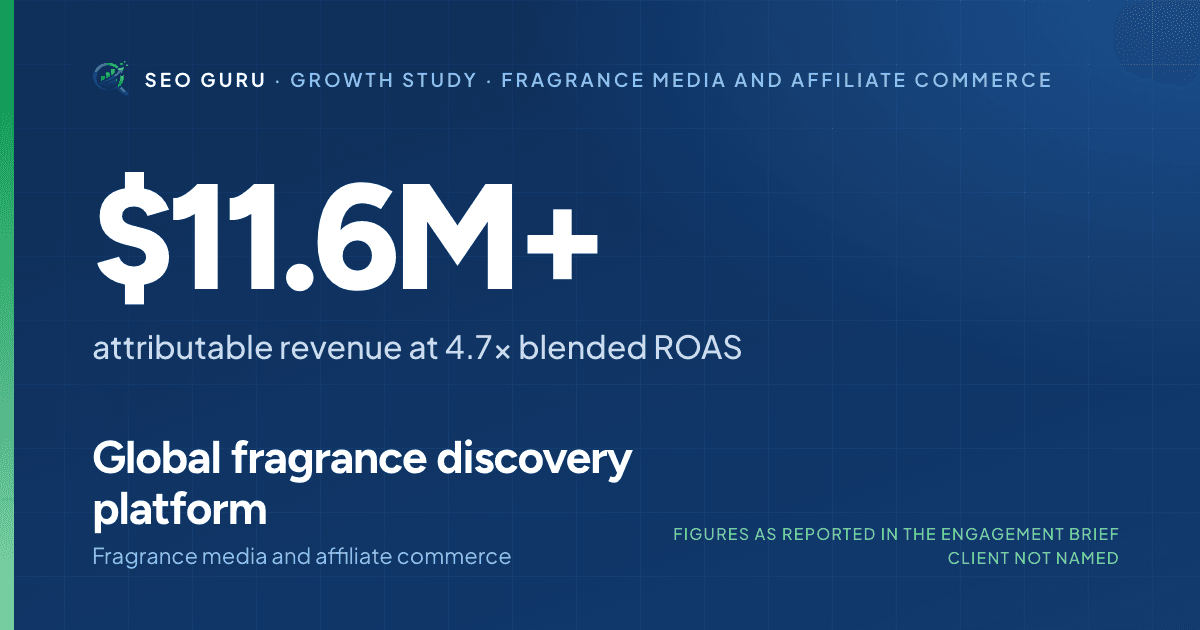
How a $280K-a-month media programme across Search, Performance Max, Shopping, Demand Gen and Meta produced $11.6M+ in attributable revenue at 4.7x ROAS.
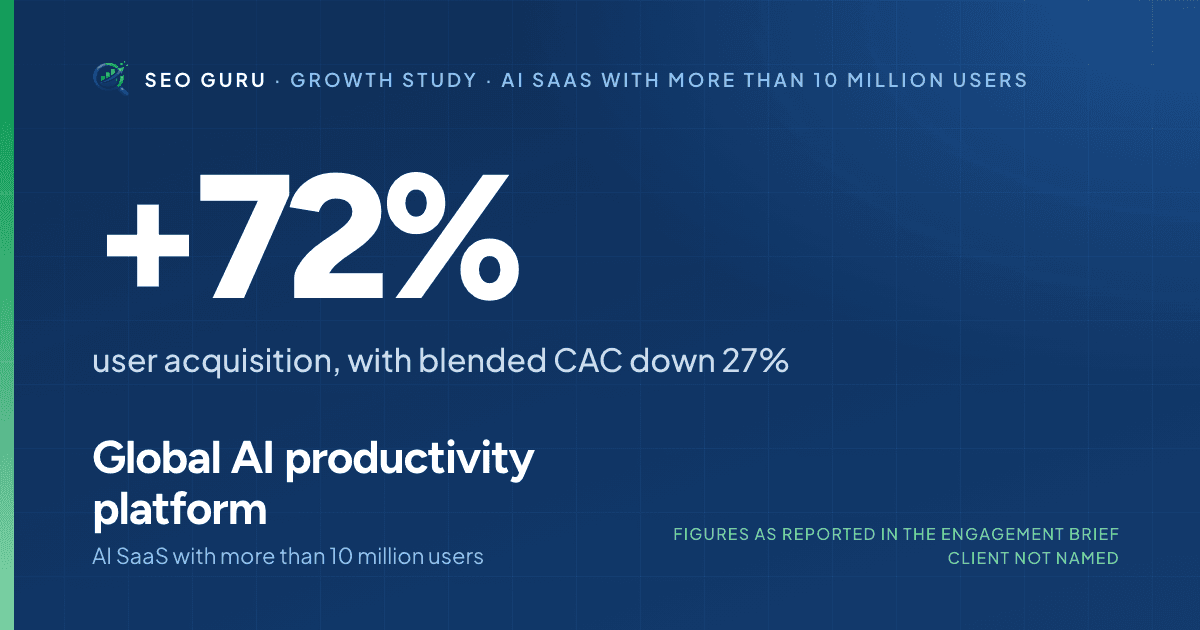
How intent-led funnels, onboarding and plan experiments and localisation across 20+ markets lifted a 10M-user AI platform's acquisition 72% at 27% lower CAC.
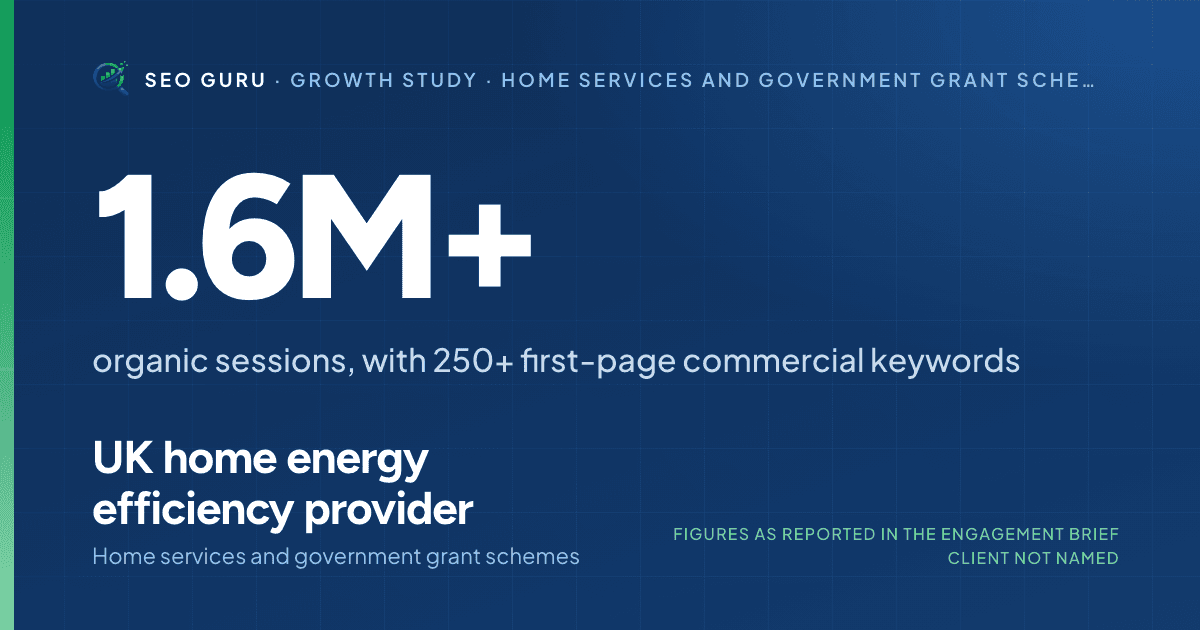
How topical clusters around ECO4, insulation and boiler grants, plus crawl and indexation fixes, drove 1.6M+ organic sessions and 250+ first-page keywords.
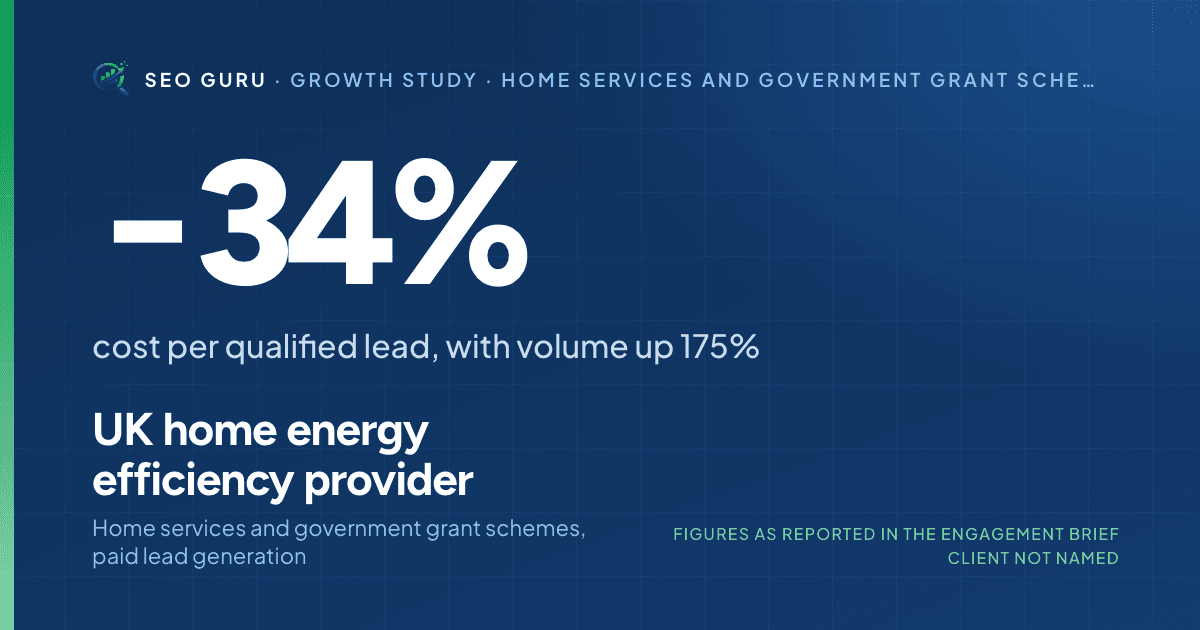
How always-on Meta and Google lead campaigns across England and Wales cut cost per qualified lead 34% while qualified volume rose 175% for an energy provider.
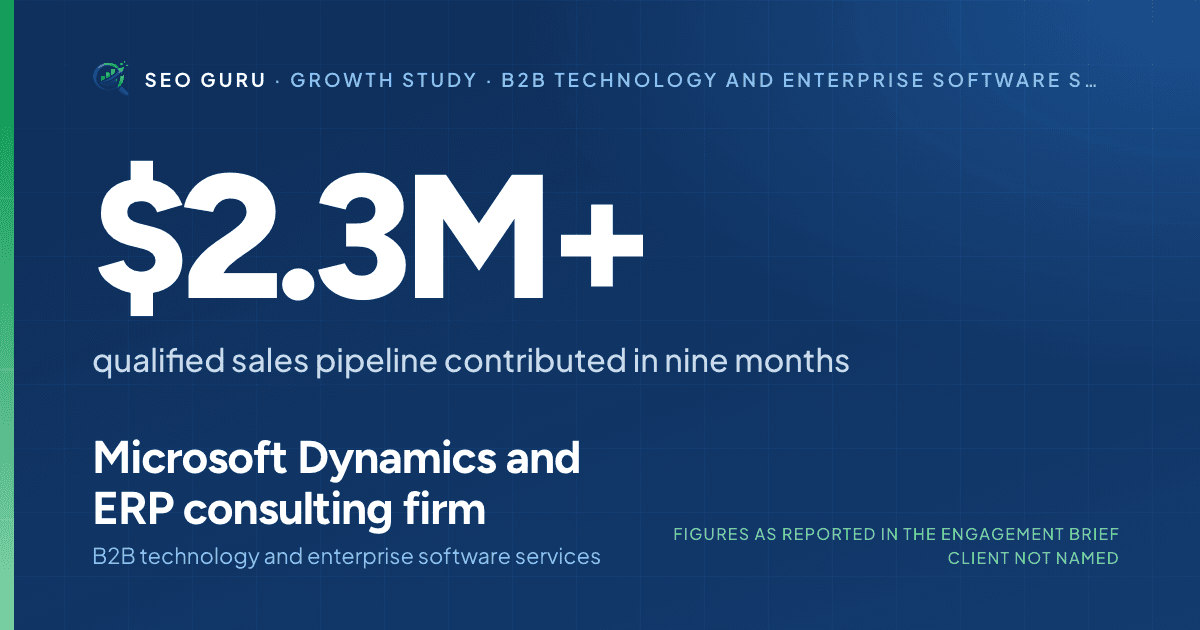
How paid search, solution landing pages, SEO clusters and CRM nurturing contributed $2.3M+ in qualified pipeline for an ERP consultancy in nine months.
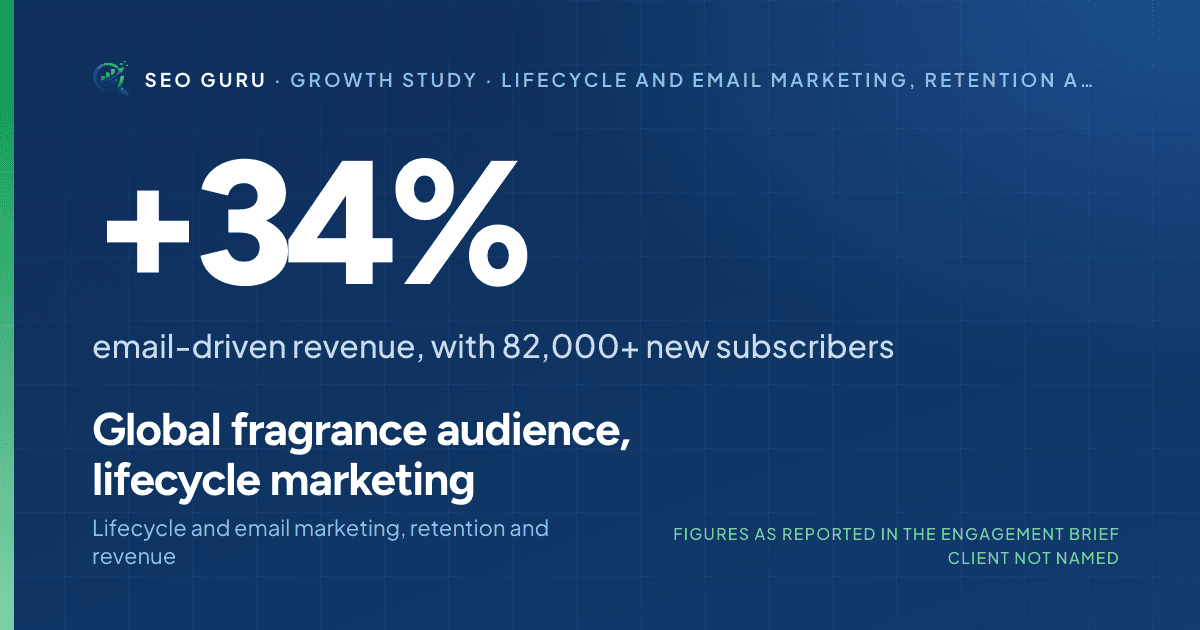
How sign-up forms and a welcome, browse, cart and re-engagement flow stack grew email revenue 34% and added 82,000+ subscribers at 97.9% deliverability.
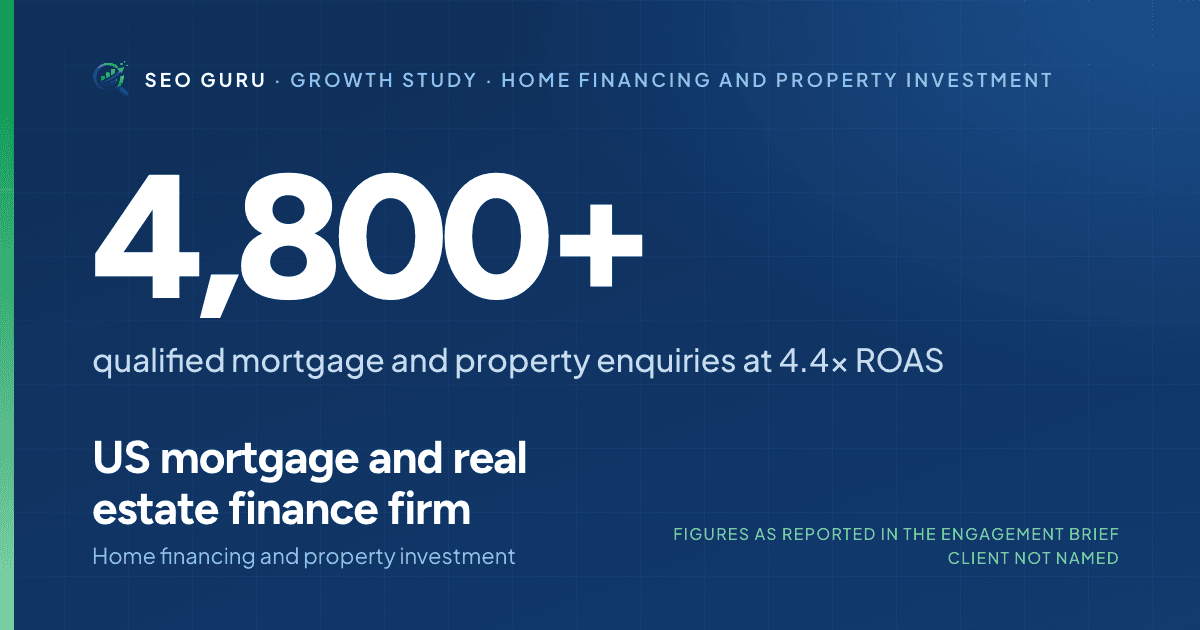
How separate Meta funnels for homebuyers and investors, scenario creative and shorter forms produced 4,800+ qualified enquiries and 72% more appointments.
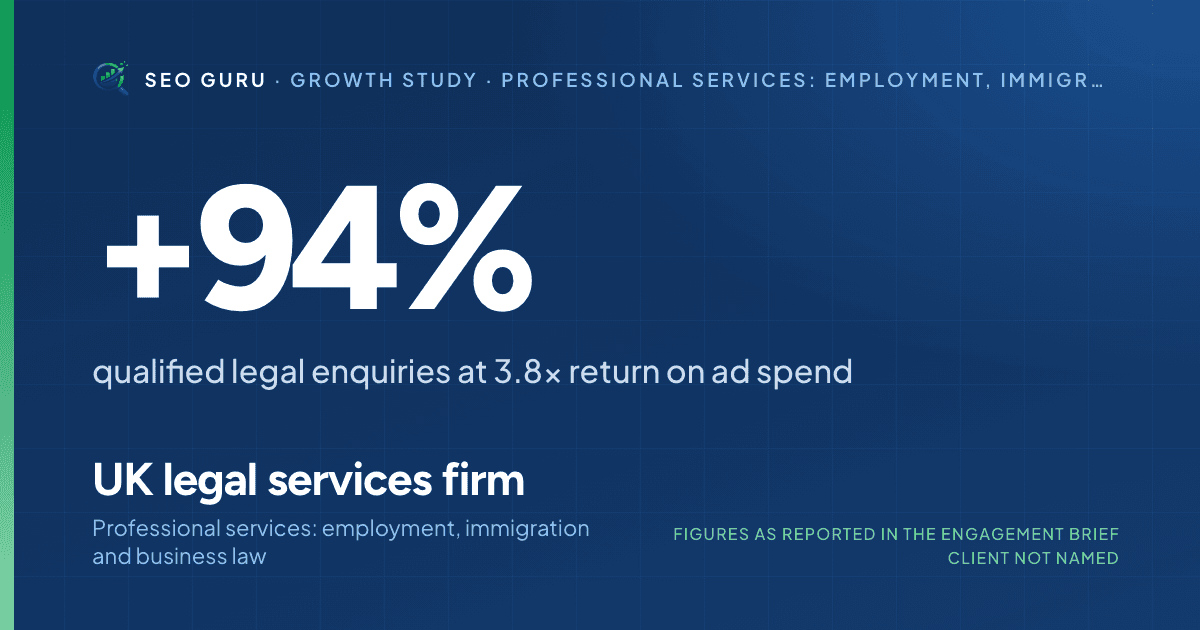
How Google Ads split by service line and region, call tracking, negative keywords and rebuilt service pages lifted a law firm's qualified enquiries 94%.
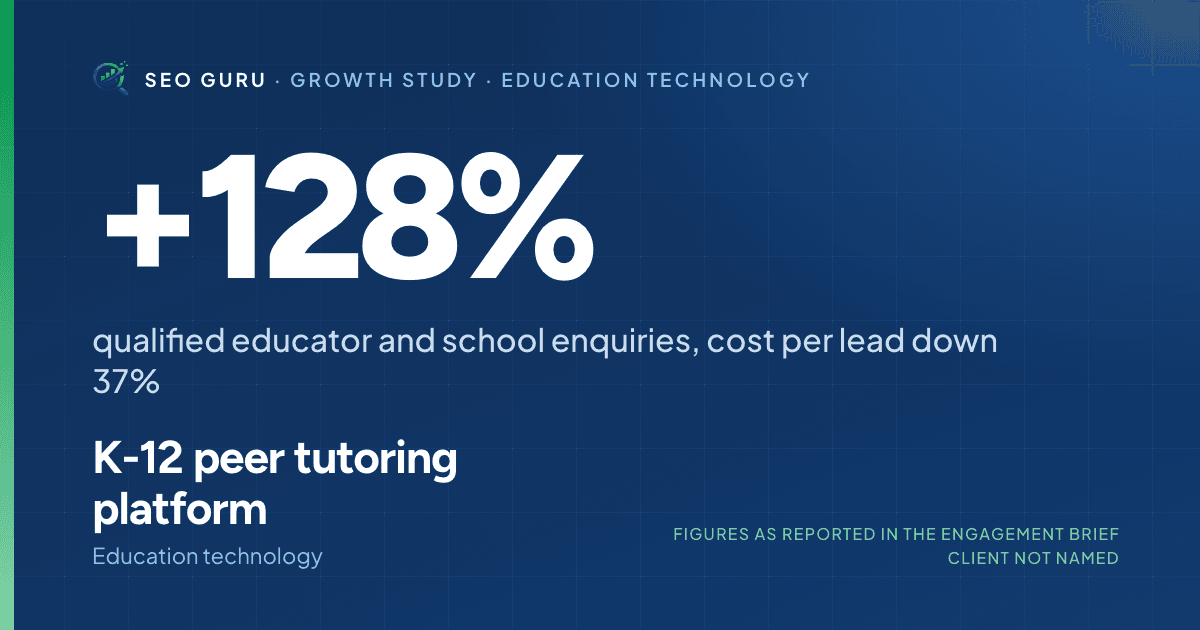
How separate funnels for educators, schools, districts and parents, demo-intent landing pages and a GA4 attribution stack lifted qualified enquiries 128%.
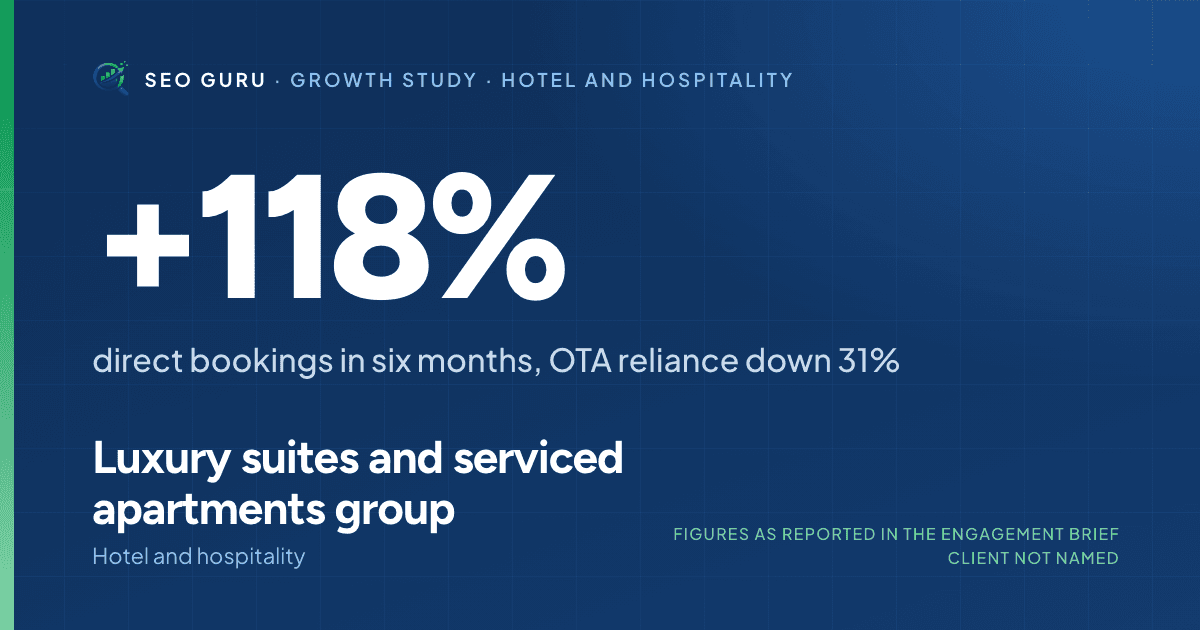
How a rebuilt reservation flow, Performance Max and Meta retargeting lifted a hospitality group's direct bookings 118% in six months and cut OTA reliance 31%.
| Engagement | Sector | Headline | Evidence in the brief |
|---|---|---|---|
| Premium skincare DTC brand | Beauty and personal care, direct-to-consumer e-commerce | $4.3M+ attributable revenue at 4.2–5.1x ROAS | The store's sales dashboard for 1–31 March 2026, and Meta Ads Manager showing purchase ROAS by campaign for the same month |
| Global fragrance discovery platform | Fragrance media and affiliate commerce | $11.6M+ attributable revenue at 4.7x blended ROAS | A cross-channel attribution platform showing paid sources over twelve months, and Google Ads campaign reporting in a non-USD market (Hungarian forint) |
| Global AI productivity platform | AI SaaS with more than 10 million users | +72% user acquisition, with blended CAC down 27% | The brief's growth-against-baseline chart; it includes no platform screenshot |
| UK home energy efficiency provider | Home services and government grant schemes | 1.6M+ organic sessions, with 250+ first-page commercial keywords | Google Search Console, November 2025 compared with October 2025, site-wide and for the regional service cluster |
| UK home energy efficiency provider | Home services and government grant schemes, paid lead generation | −34% cost per qualified lead, with volume up 175% | Meta Ads Manager, lead campaigns by cost per form lead, 1–31 December 2025 |
| Microsoft Dynamics and ERP consulting firm | B2B technology and enterprise software services | $2.3M+ qualified sales pipeline contributed in nine months | Figures as reported in the engagement brief; it includes no platform screenshot |
| Global fragrance audience, lifecycle marketing | Lifecycle and email marketing, retention and revenue | +34% email-driven revenue, with 82,000+ new subscribers | The email platform's campaign reports for March 2026, including the top campaigns by open rate, click rate and revenue |
| US mortgage and real estate finance firm | Home financing and property investment | 4,800+ qualified mortgage and property enquiries at 4.4x ROAS | Figures as reported in the engagement brief; it includes no platform screenshot |
| UK legal services firm | Professional services: employment, immigration and business law | +94% qualified legal enquiries at 3.8x return on ad spend | Google Ads, call and web campaigns by region with phone-call volume, 1–31 January 2026 |
| K-12 peer tutoring platform | Education technology | +128% qualified educator and school enquiries, cost per lead down 37% | Figures as reported in the engagement brief; it includes no platform screenshot |
| Luxury suites and serviced apartments group | Hotel and hospitality | +118% direct bookings in six months, OTA reliance down 31% | Figures as reported in the engagement brief; it includes no platform screenshot |
What a study has to contain
This standard was published here before any study was, and it is what each of the 15 above is held to. Most agency case studies would not clear it.
- A baseline captured before the work started. A result with no starting number is not a result, and reconstructing one afterwards is guesswork that always flatters.
- The window it was measured over. A percentage without a date range can describe almost anything, including normal seasonal movement. Where a brief gives no window, the study says so rather than implying one.
- What was actually changed. Specific enough that somebody could attempt the same thing, rather than a list of services that were purchased.
- What did not work, or what the evidence does not show. Every engagement has some of the first, and every brief has some of the second. A study where everything succeeded and everything is proven is a brochure.
- Permission to publish the figures, and to name the client where they are named. Consent to the engagement is not consent to publish, which is why eleven of these studies carry no name.
Source and method
The 4search studies are transcribed from reports built on each client's own Google Search Consoleaccount, linked from each study so the transcription can be checked against the screenshots. Classic search figures are from the Performance report; AI-answer figures are from the Generative AI features report, which counts how often a page appeared inside Google's AI-generated answers.
The 11growth studies are transcribed from engagement briefs, also linked. Their figures are kept as the brief states them, including rounding and currency; where a figure is read off a screenshot rather than the brief's own outcomes row, the study says so and shows the arithmetic.
The measurement methodology is written out in full so you can run it yourself. On a call we will pull your live visibility while we talk — a number about you rather than about a former client, and checkable on the spot.