
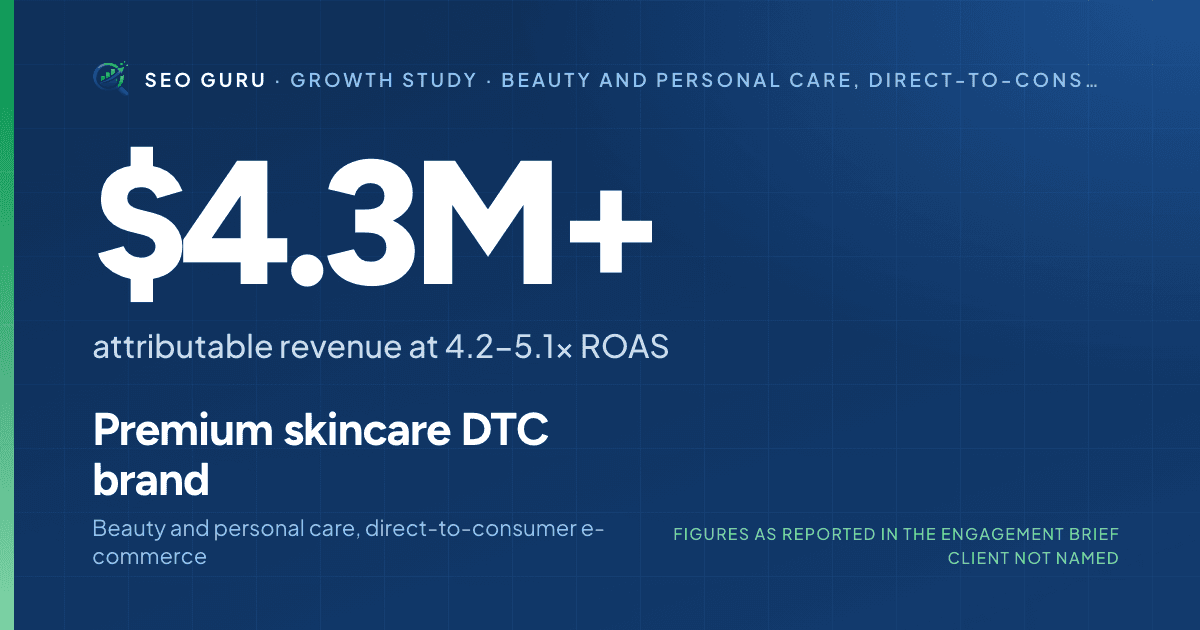
At a glance
Meta AdsGoogle AdsLanding page CROOffer and AOV strategyConversion tracking
Starting point
Purchase conversion stood at 2.0% before the work, and the account had no clear split between prospecting and retargeting: overlapping campaigns reached the same audiences, which made every creative test hard to read.
Tracking could not tell the campaigns and angles that produced purchases from the ones that only produced cheap clicks, so budget followed click cost rather than revenue.
What we did
- Rebuilt the campaign structure on Meta and Google into distinct prospecting and retargeting layers, so each audience saw a message matched to where it was in the purchase decision.
- Tested user-generated creative against founder-led concepts on a fixed offer set: the offer held constant, so the test measured the creative and not the discount.
- Shipped conversion-focused landing pages matched to each ad's promise, and introduced bundle offers to lift average order value without discounting the brand.
- Cleaned up conversion tracking and the post-click flow, so spend could move to the angles that produced attributed purchases rather than the ones that produced clicks.
Results
- More than $4.3M in attributable revenue across the engagement.
- ROAS of 4.2x to 5.1x across Meta and Google, with cost per purchase down 36%.
- Purchase conversion rate up from 2.0% to 4.9%.
- In the month shown, March 2026, the store recorded 830 orders and a 66.5% returning-customer rate on US$282.9K of gross sales: acquisition and retention moving together.
What moved
What this study does not show
- The brief shows one representative month rather than the engagement's full window, so the $4.3M figure cannot be checked here against a dated period, and the Meta screenshot shows purchase ROAS by campaign for March 2026 only.
- ROAS is reported as a range because Meta and Google are measured separately; the brief gives no blended figure, and attributed revenue depends on each platform's attribution window.
- The client is not named.
Evidence
Every figure on this page is transcribed from the engagement brief, which is linked below. Where the brief includes a platform screenshot, the section above says what it shows and for which period; where it does not, the study says so. The client is not named, so the figures cannot be checked against a public property.
Related services
- E-commerce SEO — SEO
- Shopify SEO — SEO
- SEO Analytics — SEO
More growth studies
Want the same measurement on your site?
Thirty minutes with a senior strategist. We pull your live visibility while we talk, and the figures you see are about you rather than about a former client. Book a discovery call →