
At a glance
Google Ads SearchPerformance MaxShoppingDemand GenMeta prospecting and remarketingAffiliate landing pathsCross-channel attribution
Starting point
Readers arrived at every level of purchase intent, from editorial discovery to active product consideration, and each advertising platform reported its own version of success. There was no shared basis for comparing a Meta prospecting dollar with a Shopping or Demand Gen one.
Affiliate revenue leaked between editorial interest and the tracked commercial action, so a share of the audience converted somewhere no platform could attribute.
What we did
- Managed more than $280K a month across Google Search, Performance Max, Shopping, Demand Gen and Meta prospecting and remarketing, in several international markets, including one reported in local currency.
- Segmented audiences by purchase intent, so budget and creative followed where a reader was in the decision rather than which platform they happened to be on.
- Ran a fixed creative-testing cadence across markets, so results stayed comparable from one market to the next.
- Rebuilt the affiliate landing paths to shorten the distance between an editorial page and a tracked, attributable purchase.
- Put every paid source on one cross-channel attribution view, so budget could move between channels on a shared basis.
Results
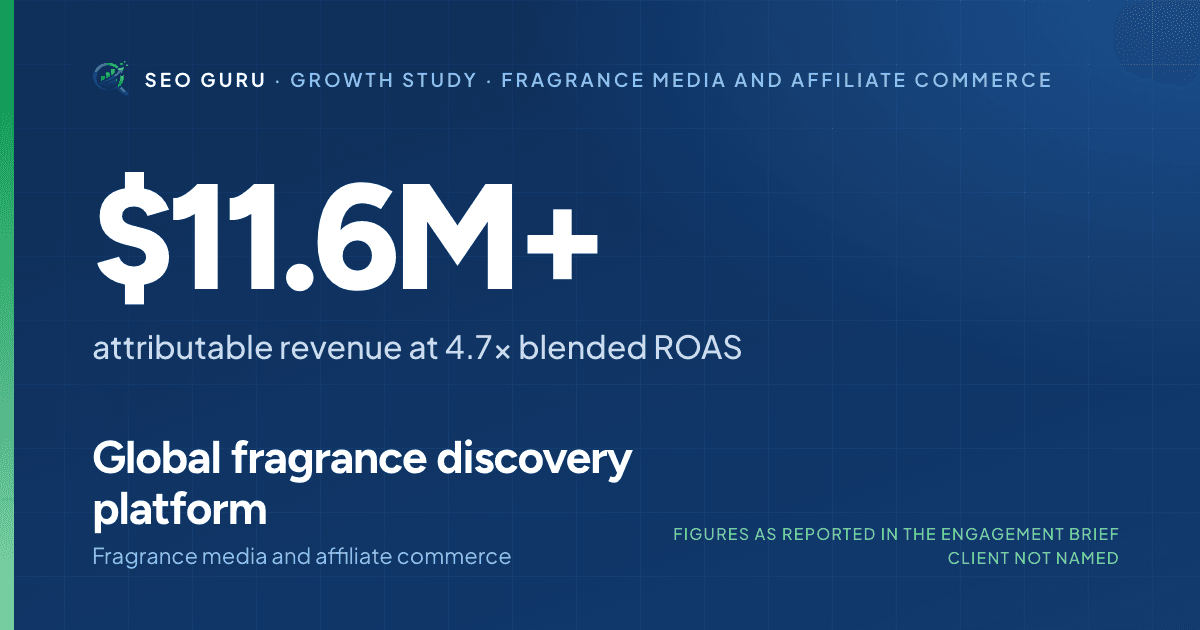
- More than $11.6M in attributable revenue across the programme.
- 4.7x blended ROAS, with blended CPA down 29%.
- Qualified traffic up 68% while acquisition cost fell.
- In the twelve-month attribution view, Google Ads returned 5.69x on 3,208 purchases, the strongest of the four paid sources, and the four together recorded 14,442 purchases.
What moved
What this study does not show
- The attribution screenshot covers paid sources over one year and shows $1.80M of purchase value at 1.92x across the four sources. The $11.6M and 4.7x headlines describe the whole programme, including affiliate revenue, over a span the brief does not date, and the brief does not reconcile the two views.
- Meta, the largest source by purchases, returned 1.69x in that view against Google's 5.69x: the channel mix, not the average, decided efficiency.
- The client and the markets are not named, and the Google Ads evidence is in Hungarian forint, so cross-market comparison depends on exchange rates the brief does not state.
Evidence
Every figure on this page is transcribed from the engagement brief, which is linked below. Where the brief includes a platform screenshot, the section above says what it shows and for which period; where it does not, the study says so. The client is not named, so the figures cannot be checked against a public property.
Related services
- E-commerce SEO — SEO
- International SEO — SEO
- SEO Analytics — SEO
More growth studies
Want the same measurement on your site?
Thirty minutes with a senior strategist. We pull your live visibility while we talk, and the figures you see are about you rather than about a former client. Book a discovery call →